A modified humic foundation
AdSorb is an Australian-produced sulfonated humate. Sulfonation changes molecular functionality while retaining humate-like nutrient interactions. It is a mixture, not one fixed molecule.
 AdSorbFIELD GUIDE & CALCULATOR

AUSTRALIAN-PRODUCED • SULFONATED HUMATE
Plan your AdSorb application.
Explore nitrogen efficiency in litres.
Put soil holding capacity in context.
A modified humate for your liquid nutrition program. Start with the paddock, the UAN application and the soil zone you actually treat.
Calculate your scenario ↗Explore the field observation ↓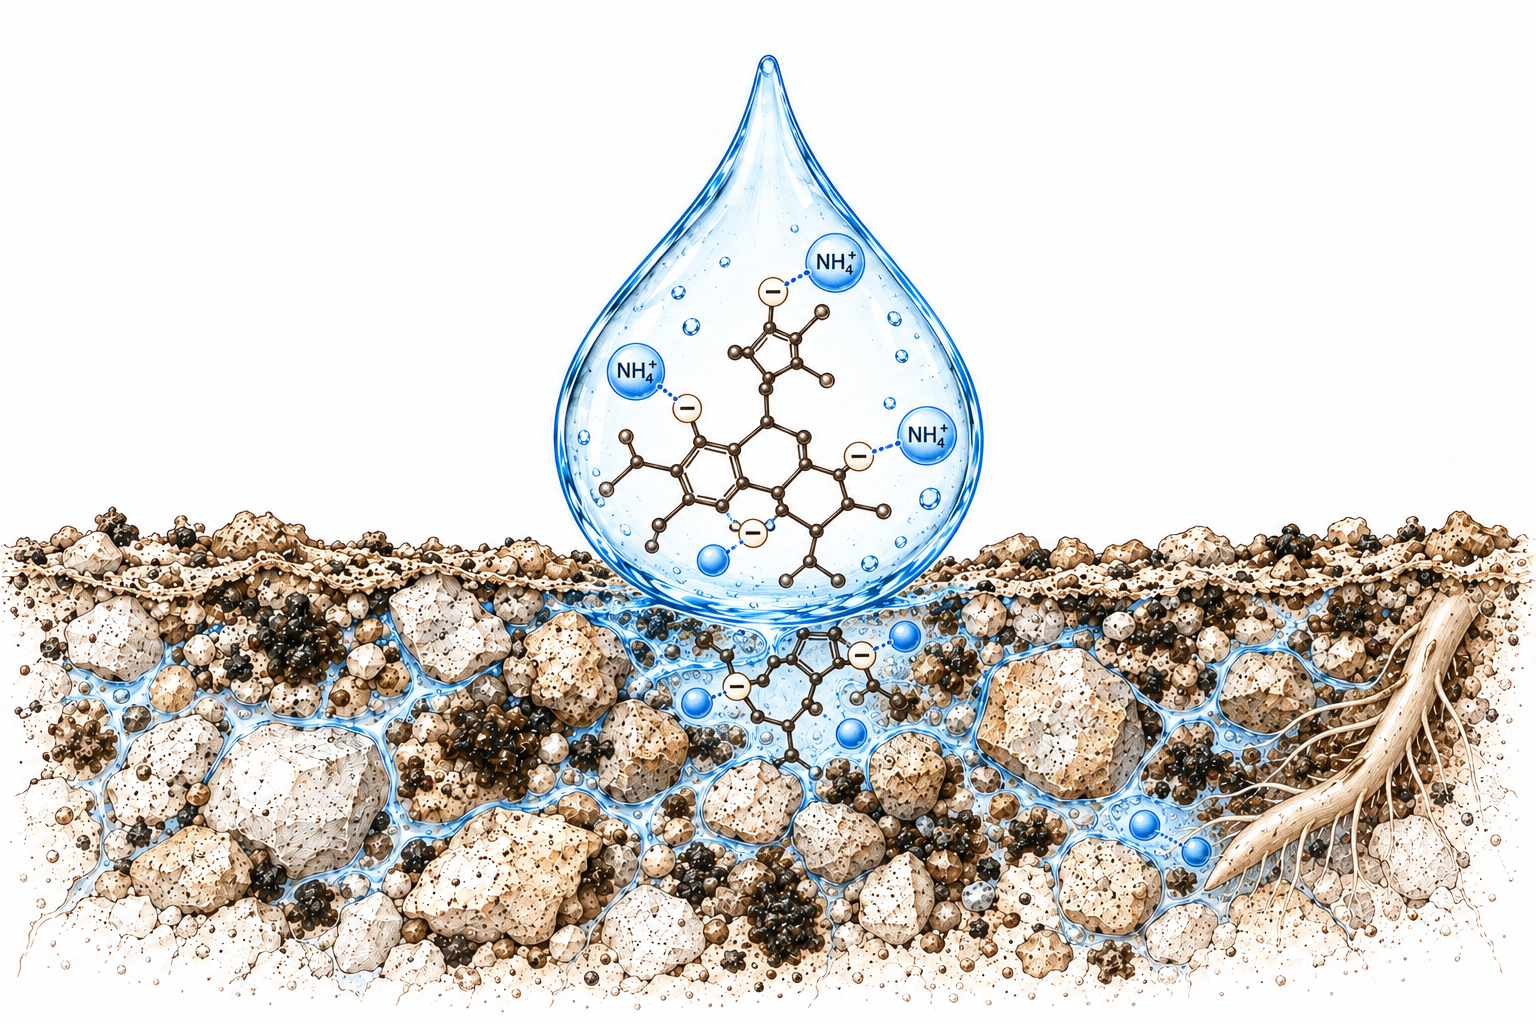
01 / NITROGEN PLANNER
Compare a hypothetical reduction in leaching, or enter nitrogen recovery percentages from your own scenario. The calculator keeps these two measures separate.
Lower CEC can mean less ammonium buffering. Sandy soils often also drain rapidly. Nitrate itself is not held by CEC. The values below are editable loss scenarios, not measured CEC-to-NUE relationships.
When linked, the planner interpolates between these entered anchors and caps at the end values outside CEC 2–20. It does not change AdSorb’s assumed response curve or measured soil CEC.
BD presets are indicative starting values, not measured site values. Gravel correction assumes the entered BD describes the fine-earth matrix. Texture and BD alone do not determine nitrate leaching; enter your loss scenario below.
0.422 kg N/L is a UAN example, not every liquid N product. Prices are editable examples. The starting 1:20 volume ratio follows the requested planning rate; the response is hypothetical.
This response curve is a hypothesis, not a measured AdSorb dose-response. The 33% root-zone observation does not set these values. At zero AdSorb the model assumes zero product benefit.
The at-risk pool can include ammonium and urea converted to nitrate over time. Use 25% only to assess the initial nitrate fraction of standard UAN. Baseline losses are scenario inputs, not soil-type predictions.
YOUR SCENARIO
Simplified equal-outcome calculation: assumes the entered loss or recovery percentages stay constant when UAN rate changes. It is not a rate recommendation. Do not add this saving to the extra-N value above.
CROP RESPONSE / THREE PROGRAM OPTIONS
Compare crop revenue after diminishing N response and an optional, hypothetical root-zone stress penalty. The same stress rule applies to every option. No toxicity protection is assigned to AdSorb.
Starting values illustrate a curve; they are not a canola recommendation or an AdSorb trial fit. Use your paddock response data.
This is a sensitivity test, not a validated toxicity model. High nitrate salt concentration, ammonia/ammonium injury and nutrient imbalance are different issues. No universal nitrate-N injury threshold is assumed.
Uses the contact soil mass from “Soil & placement” below. The 25% nitrate fraction is an initial UAN example; nitrification and time can change it. This loading proxy excludes transport, sorption, uptake, moisture and salt composition. It is not a soil-solution concentration or measured nitrate exposure. The same rate gives the same initial loading with or without AdSorb.
POTENTIAL MARGIN DIFFERENCE
Modelled yield versus UAN L/ha. Curves use the same crop response and, if enabled, the same stress rule. More UAN keeps baseline efficiency; AdSorb uses the current ratio-response assumption, or your fixed entered reduction.
Effective fertiliser N = applied UAN × kg N/L × entered efficiency. In leaching mode, multiply retained N by crop-capture %. Recovery mode already represents crop recovery, so the additional capture factor is not used. Yield before stress = starting yield + (yield ceiling − starting yield) × [1 − exp(−ln(10) × effective N / N90)]. This is an illustrative saturating response, not a calibrated crop model.
If enabled, nitrate-N loading = background mg/kg + applied UAN × kg N/L × nitrate fraction × 1,000,000 ÷ contact soil kg/ha. Hypothetical penalty = minimum(maximum penalty, excess mg/kg / 100 × penalty slope). Final yield = unstressed yield × (1 − penalty/100). This same rule applies to baseline, AdSorb and additional UAN.
Crop-value gain = (option yield − baseline yield) × crop price. Value above/below cost = crop-value gain − extra program cost. Baseline cost is current UAN cost; AdSorb adds its product/pass costs; more UAN adds extra litres/pass costs. Program margin = crop revenue − these N program costs only. It is not whole-farm profit. Do not add nitrogen replacement value to crop-value gain.
Setting additional UAN to match effective N equates N supply before the stress adjustment; it does not necessarily match final yield. With identical effective N and no stress, both options give identical modelled yield, so the lower extra cost wins. Near the yield ceiling, the response to additional effective N diminishes. AdSorb can also increase retained root-zone N; it is not assumed to remove toxicity risk.
Context: Canola Council — nitrogen, placement and salt/ammonia effects ↗ · Canola root responses to ammonia/ammonium exposure ↗ · Economic N-rate principles ↗. These sources do not supply the curve parameters or nitrate-proxy threshold used here.
Extra nitrogen expressed as UAN-equivalent litres at your selected percentages. This is a UAN-rate sweep at a constant AdSorb:UAN ratio. The dollar table follows the selected value basis; crop-response rows compare AdSorb with baseline at each UAN rate.
| UAN L/ha | Extra N kg/ha | UAN equivalent L/ha | Crop-value gain A$/ha | Value minus cost A$/ha |
|---|
Recovery NUE = crop uptake of fertiliser-derived N ÷ fertiliser N applied × 100. Enter recovery estimates or measured values from a valid fertiliser-N recovery assessment; ordinary total crop N uptake includes soil-derived N. A treatment-minus-zero-N estimate is apparent recovery and should be identified as such.
Leaching mode: extra N retained = UAN L/ha × kg N/L × baseline loss fraction × relative loss reduction. The remaining N is not a crop uptake or yield prediction. Recovery mode: extra N recovered = applied N × (scenario recovery − baseline recovery). Relative improvement is the gain divided by the baseline outcome; percentage points are the difference in percentages.
Potential replacement value = extra N ÷ UAN kg N/L × UAN price × useful fraction. Treatment cost = AdSorb rate × price + extra application cost. Other N losses and crop uptake may limit realised benefit. AdSorb dose changes cost and, in illustrative curve mode, the assumed leaching reduction. The curve is not calibrated to AdSorb trial data.
RATIO / RETENTION / RETURN
Change either product price, UAN rate or AdSorb ratio above. These charts use the same loss scenario and crop-response assumptions as the planner.
Horizontal axis: litres AdSorb per 100 L UAN. Higher concentration is a smaller 1:x denominator. Vertical axis: relative reduction in baseline nitrate loss.
Crop-value gain minus AdSorb and additional application costs. The curve includes diminishing N response; nitrogen replacement value is shown separately and is not added to yield revenue.
Compare the same UAN, AdSorb response, prices and crop curve under your three CEC/loss scenarios. A larger avoidable loss can raise the potential value, while extra product cost and diminishing crop response can limit the return.
These rows compare entered risk assumptions, not yield predictions from CEC. Rainfall, irrigation, rooting, pH, N form and timing also determine NUE. CEC and nutrient retention · Sandy-soil leaching processes
Relative loss reduction r = Emax × d / (d + K), where d is L AdSorb/L UAN. K = 0.05 × (Emax/reference reduction − 1), so the entered reference reduction occurs at 1:20. This is an illustrative saturating relationship, with no fitted AdSorb trial coefficients. In fixed-reduction mode, the entered reduction is held constant at all non-zero rates.
Applied N = UAN L/ha × kg N/L. Baseline nitrate-N loss = applied N × selected at-risk pool × baseline loss fraction. Extra N retained = baseline nitrate-N loss × relative reduction. Effective N for the crop curve = remaining N × crop-capture fraction. Grain-value gain = yield gain × crop price; net gain deducts AdSorb and extra application costs. Break-even yield gain = extra program cost ÷ crop price. UAN price affects the replacement-value and more-UAN comparisons; it cancels from the same-UAN yield comparison.
Fine-earth root-zone soil mass = 10,000 × depth (m) × BD (t/m³) × 1,000 × (1 − gravel volume fraction). Retained N concentration = additional retained kg N × 1,000,000 ÷ soil kg. This is a whole-zone mass conversion, not a measured soil-solution concentration. BD and CEC are not used to invent a retention percentage.
Soil Quality Australia: BD ranges and measurement · UAN nitrogen forms · Kong et al. (2022): humic-acid urea N leaching study. These sources provide context, not the dose-response calibration.
02 / SOIL & PLACEMENT CALCULATOR
Use the same placement approach as the MacroPrima planner: width, thickness and row spacing, or individual wetted zones. Explore the theoretical added exchange charge only when you have a measured AdSorb capacity.
Use results for comparable pH, ionic strength and test method. No AdSorb product-capacity result has been supplied; these fields intentionally start blank. Organic carbon or total humate percentage alone is not exchange capacity.
Only the rate and gravel-soil description are from the field observation. Zone dimensions, CEC and UAN rate were not supplied.
TREATED SOIL PER HECTARE
*Assumes all applied UAN contacts this soil mass. This is a concentration scenario, not measured distribution.
Negative exchange sites can associate with ammonium, calcium, magnesium and potassium. They are shared, competing sites. The NH₄-N equivalent assumes every added exchange site is occupied by ammonium; it is an upper-bound charge conversion, not a forecast of extra N retained.
Nitrate is negatively charged and moves with water. Added CEC does not directly bind it. Water-holding capacity also needs its own measurements; this calculator does not predict extra millimetres of water stored.
Continuous band volume = 10,000 m²/ha ÷ row spacing (m) × width (m) × treated thickness (m). Individual-zone volume = width × length × thickness × number/ha. Whole-layer volume = 10,000 × thickness. Fine-earth soil mass = volume × fine-earth bulk density × 1,000 kg/m³ × (1 − gravel volume fraction). Dimensions must not imply overlapping zones or more than a hectare of surface.
Added charge (cmol(+)/ha) = AdSorb L/ha × measured cmol(+)/L. With dry-active inputs, cmol(+)/L = active g/L ÷ 1,000 × active CEC cmol(+)/kg. Local addition = added charge ÷ treated soil kg. Whole-layer addition uses all soil in that thickness across a hectare. Upper-bound ammonium-N equivalent = added charge × 0.000140067 kg N/cmol(+).
This additive charge model assumes all measured product capacity remains accessible in the defined zone. It does not model pH, sorption, degradation, cation competition or changes in measured soil CEC. It does not calibrate a nitrogen loss reduction. Small contact volumes amplify local concentration without creating extra total exchange sites.
INTERNATIONAL EVIDENCE / SULFONATED HUMATES
Source-linked evidence for other formulations. Manufacturer trial summaries and peer-reviewed studies are identified separately. Published results do not calibrate the AdSorb calculator.
“Reported increase” and “statistically significant” are different. Significance is shown for the measured endpoint only. Pot or seedling responses are not grain-yield results; nitrate concentration is not nitrate mass loss. Product rates in kg/ha cannot be treated as AdSorb L/ha without formulation equivalence.
03 / THE EVIDENCE
Wilchem reports 33% more nitrate in the sampled root zone and 120 ppm more calcium following 100 mm of rainfall in a single event.
Reported by Johan Potgieter, 16 October 2026. Reported root-zone soil extract (2:1 preparation), Horiba nitrate meter. Fertiliser inputs, sampling depths, replication and significance remain unconfirmed; calcium extraction method was not supplied.
More root-zone nitrate is not the same as 33% less leaching or 33% higher crop NUE. These observations do not set the calculator’s loss-reduction or recovery assumptions. They also do not establish delayed nitrification. Explore the proposed mechanism ↓
Read the AdSorb grower guide ↗04 / HOW IT WORKS
AdSorb is an Australian-produced sulfonated humate. Sulfonation changes molecular functionality while retaining humate-like nutrient interactions. It is a mixture, not one fixed molecule.
Ammonium can associate with negatively charged surfaces. Sulfonated humates can differ from conventional extracts in solution behaviour. Product-specific charge and mixing measurements matter.
CEC, drainage, rainfall, root depth and timing all matter. The calculator links litres to your chosen N outcome and treats local exchange charge as a separate scenario.
NITROGEN TIMING / A MECHANISM TO INVESTIGATE
If nitrogen stays in the ammonium form for longer, less may be present as mobile nitrate when drainage occurs. This is a plausible pathway to investigate for AdSorb—not a demonstrated AdSorb nitrification-inhibitor claim.
Humate exchange sites could temporarily associate with NH₄⁺ and alter its availability to ammonia-oxidising organisms. Exchange is reversible: associated ammonium can still return to solution and undergo nitrification. Retention does not itself prove inhibition.
Some humic materials have affected urease activity in experiments. Slower urea breakdown could spread ammonium supply over time and delay later nitrate formation. This is a separate step from slowing ammonium oxidation.
Humic constituents can influence nitrifying organisms and their environment. The direction and size of the response depend on the material, concentration, pH and soil conditions. Sulfonation alone does not establish nitrification inhibition.
Typical UAN supplies its nitrogen as:
A delay in nitrate formation could act on the pathway followed by the 75% initially supplied as urea and ammonium. This is an eligible nitrogen pool, not a protection percentage. Delayed nitrification cannot protect the 25% already supplied as nitrate.
Urea is uncharged and can also move with water before hydrolysis. Keeping N out of the nitrate pool does not guarantee retention or crop uptake. Confirm the nitrogen forms in your supplied fertiliser.
Dong et al. (2009) found that lignite humic acids moderated the response of ammonia-oxidising bacteria to urea in soil microcosms. Proposed explanations included ammonium association and slower urea hydrolysis. The study used 1 g humic acid/kg soil and 10 g urea/kg soil—these are not equivalent to a 2 L/ha AdSorb treatment.
A 1991 continuous-flow column study found inhibition at higher humic-acid concentrations, but also relief of pH-related inhibition under other conditions. Humic effects are not uniformly inhibitory.
These studies tested other humic materials, not AdSorb or its finished sulfonated formulation. No AdSorb-specific delay in days or nitrification-reduction percentage has been established here.
Wilchem’s reported 33% more root-zone nitrate after the 100 mm rain event is compatible with greater N remaining in the sampled zone. It does not establish delayed nitrification. A delay could leave more ammonium early and more nitrate later; a single nitrate measurement cannot show that sequence or quantify leaching.
Compare equal nitrogen rates with and without AdSorb, alongside an established nitrification-inhibitor reference and an unfertilised control. Use separate urea-fed and ammonium-fed treatments to distinguish urea hydrolysis from ammonium oxidation. Sample before application and repeatedly afterwards for urea where relevant, ammonium, nitrite, nitrate, pH, moisture and temperature. Measure drainage volume and cumulative nitrate-N and total N loss in replicated soil columns, followed by field validation and crop N uptake. Nitrogen mass balance is needed to separate retention from microbial immobilisation or gaseous loss.
At 2 L/ha, measure product active concentration, exchange capacity and concentration within the actual treated soil zone. Small zones increase local concentration but do not create additional total exchange sites.
Calculator connection: no nitrification-delay benefit has been added automatically. Leaching reduction, crop recovery and yield response remain user-entered hypothetical scenarios. The 75% UAN pool is not used as a saving, and the Munglinup nitrate observation does not calibrate NUE.
05 / SOURCE LIBRARY
General chemistry and other formulations do not establish AdSorb’s product-specific compatibility, capacity or performance. All calculator defaults are editable planning assumptions unless identified as a reported observation.