01 / Broadacre
1–3 L/haCereals, canola and legumes. Integrate with a suitable liquid fertiliser program at sowing or side-dressing.
 AdGreenFIELD GUIDE & CALCULATOR

WILCHEM SIGNATURE RANGE • AUSTRALIAN MADE
Nutrient Use Efficiency Additive
AdGreen combines organic acids, amino acids, metabolites and trace elements to support nutrient uptake, nitrogen utilisation and healthy green crop growth.
A liquid nutrition partner for cereals, broadleaf crops and tree crops. Explore the benefits, plan your application and calculate the trace elements delivered.
Plan your application ↗Explore crop benefits ↓
APPLICATION / PLAN YOUR PROGRAM
Choose a crop program to calculate AdGreen requirements and trace-element delivery. Rates match the current AdGreen label; confirm your complete program before use.
YOUR ADGREEN REQUIREMENT
| Element | Analysis g/L | g/ha | Total kg |
|---|
Calculated from the finished AdGreen analysis on the current label. This is delivery, not a prediction of uptake or a correction of a diagnosed deficiency.
Cereals, canola and legumes. Integrate with a suitable liquid fertiliser program at sowing or side-dressing.
Apply through a suitable soil or fertigation program. Split applications during active growth as appropriate.
Confirm the final per-hectare rate, water quality and compatibility of the complete tank mix.
ROOT-TO-CROP / BENEFITS AT A GLANCE
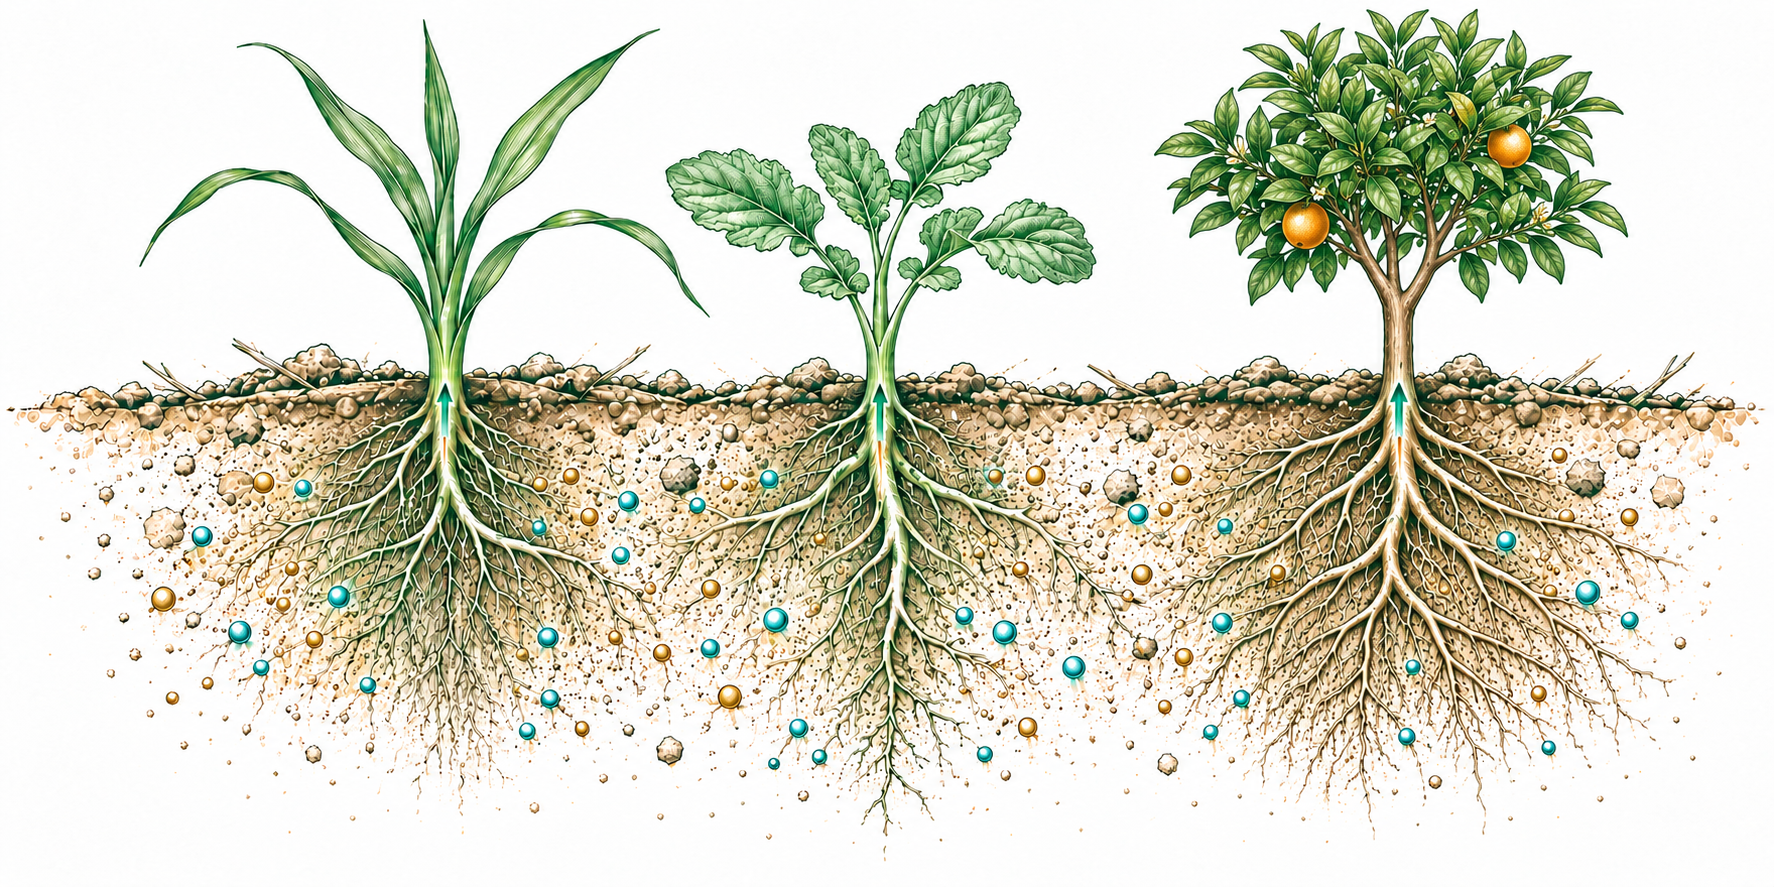
Designed to support the connection between nutrient availability, active roots and healthy crop growth.
Support the processes that help the crop make use of available nutrition.
Provide trace nutrition involved in chlorophyll formation and crop metabolism.
Support metabolic activity and crop recovery when conditions are demanding.
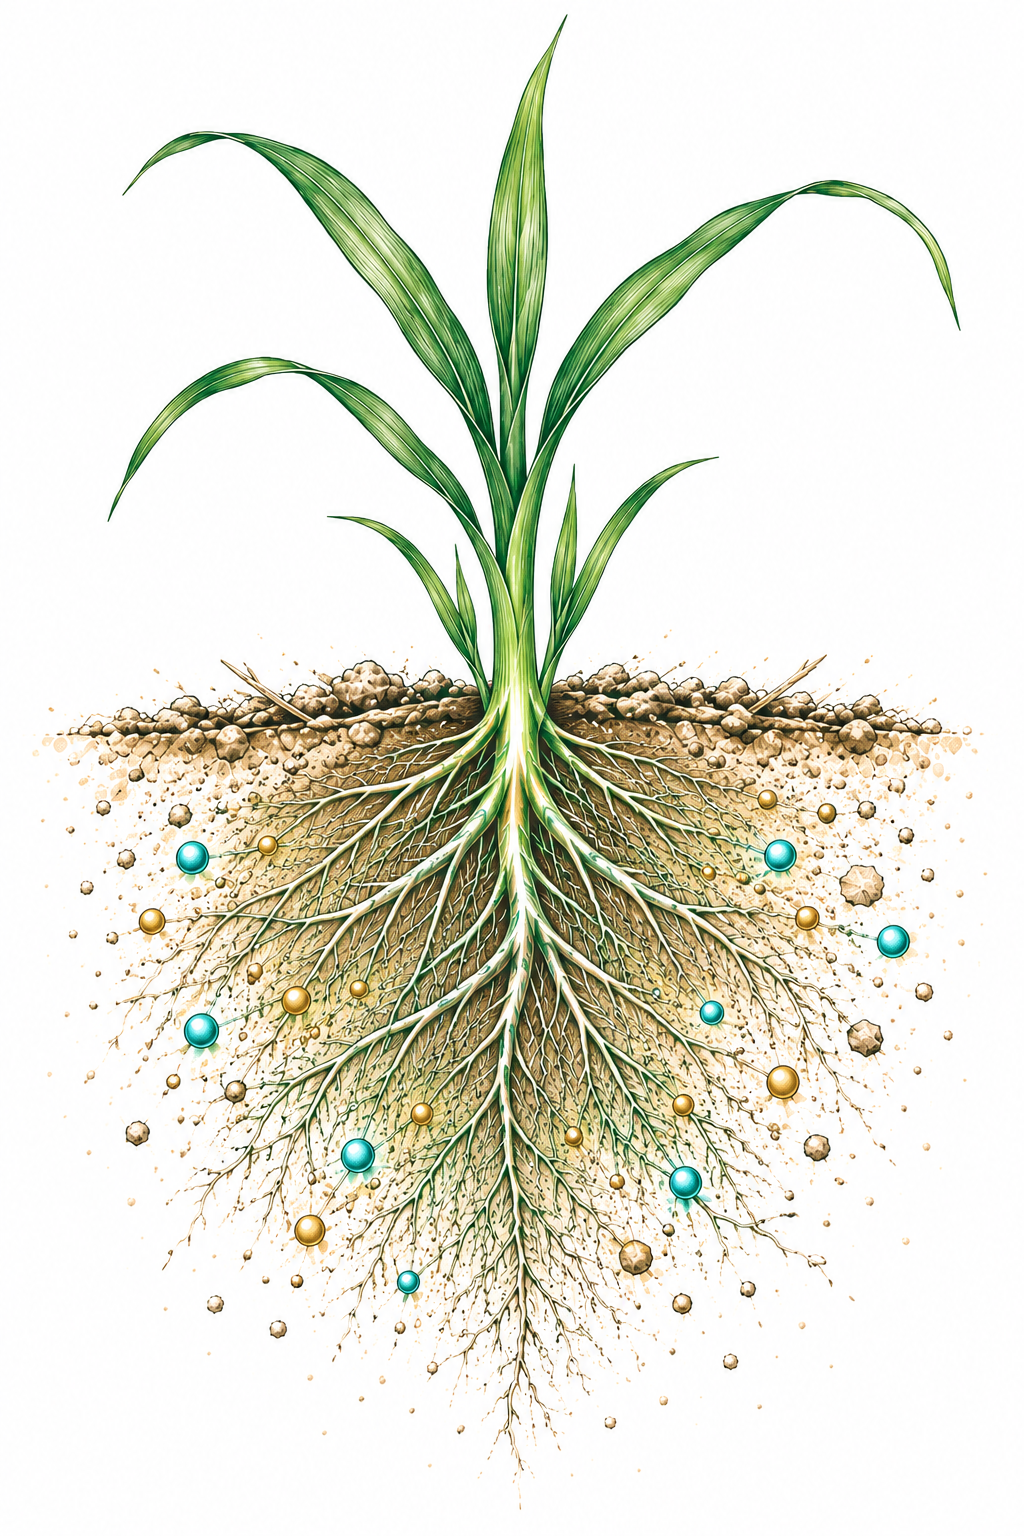
Support root growth and exploration of the surrounding soil.
Support nutrient interactions in the soil surrounding the roots.
Support nutrient uptake and the enzyme systems that turn nutrition into crop growth.
Benefits describe the intended support functions of the formulation. Response depends on soil, crop, nutrition and growing conditions.
03 / NITROGEN SCENARIOS
Compare a hypothetical reduction in leaching, or enter nitrogen recovery percentages from your own scenario. The calculator keeps these two measures separate.
0.422 kg N/L is a UAN example, not every liquid N product. Prices are examples. 2 L/ha is an example within the label’s 1–3 L/ha broadacre range. Confirm the current label for your program.
YOUR SCENARIO
Simplified equal-outcome calculation: assumes the entered loss or recovery percentages stay constant when UAN rate changes. It is not a rate recommendation. Do not add this saving to the extra-N value above.
CROP RESPONSE / THREE PROGRAM OPTIONS
Compare crop revenue after diminishing N response and an optional, hypothetical root-zone stress penalty. The same stress rule applies to every option. No toxicity protection is assigned to AdGreen.
Starting values illustrate a curve; they are not a canola recommendation or an AdGreen trial fit. Use your paddock response data.
This is a sensitivity test, not a validated toxicity model. High nitrate salt concentration, ammonia/ammonium injury and nutrient imbalance are different issues. No universal nitrate-N injury threshold is assumed.
Uses the contact soil mass from “Soil & placement” below. The 25% nitrate fraction is an initial UAN example; nitrification and time can change it. This loading proxy excludes transport, sorption, uptake, moisture and salt composition. It is not a soil-solution concentration or measured nitrate exposure. The same rate gives the same initial loading with or without AdGreen.
POTENTIAL MARGIN DIFFERENCE
Modelled yield versus UAN L/ha. Curves use the same crop response and, if enabled, the same stress rule. More UAN keeps baseline efficiency; AdGreen uses your entered efficiency, not a dose-response function.
Effective fertiliser N = applied UAN × kg N/L × entered efficiency. In leaching mode, multiply retained N by crop-capture %. Recovery mode already represents crop recovery, so the additional capture factor is not used. Yield before stress = starting yield + (yield ceiling − starting yield) × [1 − exp(−ln(10) × effective N / N90)]. This is an illustrative saturating response, not a calibrated crop model.
If enabled, nitrate-N loading = background mg/kg + applied UAN × kg N/L × nitrate fraction × 1,000,000 ÷ contact soil kg/ha. Hypothetical penalty = minimum(maximum penalty, excess mg/kg / 100 × penalty slope). Final yield = unstressed yield × (1 − penalty/100). This same rule applies to baseline, AdGreen and additional UAN.
Crop-value gain = (option yield − baseline yield) × crop price. Value above/below cost = crop-value gain − extra program cost. Baseline cost is current UAN cost; AdGreen adds its product/pass costs; more UAN adds extra litres/pass costs. Program margin = crop revenue − these N program costs only. It is not whole-farm profit. Do not add nitrogen replacement value to crop-value gain.
Setting additional UAN to match effective N equates N supply before the stress adjustment; it does not necessarily match final yield. With identical effective N and no stress, both options give identical modelled yield, so the lower extra cost wins. Near the yield ceiling, the response to additional effective N diminishes. AdGreen can also increase retained root-zone N; it is not assumed to remove toxicity risk.
Context: Canola Council — nitrogen, placement and salt/ammonia effects ↗ · Canola root responses to ammonia/ammonium exposure ↗ · Economic N-rate principles ↗. These sources do not supply the curve parameters or nitrate-proxy threshold used here.
Extra nitrogen expressed as UAN-equivalent litres at your selected percentages. This is not a dose-response curve for AdGreen. The dollar table follows the selected value basis; crop-response rows compare AdGreen with baseline at each UAN rate.
| UAN L/ha | Extra N kg/ha | UAN equivalent L/ha | Crop-value gain A$/ha | Value minus cost A$/ha |
|---|
Recovery NUE = crop uptake of fertiliser-derived N ÷ fertiliser N applied × 100. Enter recovery estimates or measured values from a valid fertiliser-N recovery assessment; ordinary total crop N uptake includes soil-derived N. A treatment-minus-zero-N estimate is apparent recovery and should be identified as such.
Leaching mode: extra N retained = UAN L/ha × kg N/L × baseline loss fraction × relative loss reduction. The remaining N is not a crop uptake or yield prediction. Recovery mode: extra N recovered = applied N × (scenario recovery − baseline recovery). Relative improvement is the gain divided by the baseline outcome; percentage points are the difference in percentages.
Potential replacement value = extra N ÷ UAN kg N/L × UAN price × useful fraction. Treatment cost = AdGreen rate × price + extra application cost. Other N losses and crop uptake may limit realised benefit. AdGreen dose changes product requirement and cost here; no measured AdGreen dose-to-NUE function has been supplied.
04 / SOIL & PLACEMENT CALCULATOR
Define your application placement using width, thickness and row spacing, or individual wetted zones. Explore the theoretical added exchange charge only when you have a measured AdGreen capacity.
Use results for comparable pH, ionic strength and test method. No AdGreen product-capacity result has been supplied; these fields intentionally start blank. Organic carbon or total humate percentage alone is not exchange capacity.
The 2 L/ha example is within the label’s broadacre range. Soil dimensions and density remain editable assumptions.
TREATED SOIL PER HECTARE
*Assumes all applied UAN contacts this soil mass. This is a concentration scenario, not measured distribution.
Negative exchange sites can associate with ammonium, calcium, magnesium and potassium. They are shared, competing sites. The NH₄-N equivalent assumes every added exchange site is occupied by ammonium; it is an upper-bound charge conversion, not a forecast of extra N retained.
Nitrate is negatively charged and moves with water. Added CEC does not directly bind it. Water-holding capacity also needs its own measurements; this calculator does not predict extra millimetres of water stored.
Continuous band volume = 10,000 m²/ha ÷ row spacing (m) × width (m) × treated thickness (m). Individual-zone volume = width × length × thickness × number/ha. Whole-layer volume = 10,000 × thickness. Soil mass = volume × bulk density × 1,000 kg/m³. Dimensions must not imply overlapping zones or more than a hectare of surface.
Added charge (cmol(+)/ha) = AdGreen L/ha × measured cmol(+)/L. With dry-active inputs, cmol(+)/L = active g/L ÷ 1,000 × active CEC cmol(+)/kg. Local addition = added charge ÷ treated soil kg. Whole-layer addition uses all soil in that thickness across a hectare. Upper-bound ammonium-N equivalent = added charge × 0.000140067 kg N/cmol(+).
This additive charge model assumes all measured product capacity remains accessible in the defined zone. It does not model pH, sorption, degradation, cation competition or changes in measured soil CEC. It does not calibrate a nitrogen loss reduction. Small contact volumes amplify local concentration without creating extra total exchange sites.
FORMULATION / PRACTICAL USE
| Constituent | Analysis |
|---|---|
| Zinc (Zn) | 4.8 g/L |
| Manganese (Mn) | 1.6 g/L |
| Copper (Cu) | 0.5 g/L |
| Iron (Fe) | 1.5 g/L |
| Boron (B) | 1.0 g/L |
| Molybdenum (Mo) | 2.0 g/L |
| Organic acids | Present |
| Metabolites | Present |
SG: To be confirmed | pH: To be confirmed
Expiry / shelf life: To be confirmed
The supplied brochure describes a combination of organic acids, amino acid complexes, nonliving Trichoderma harzianum metabolites and trace elements. The metabolites are not a live microbial inoculant.
Confirm compatibility of the complete mix before use. Use the current label and advice for your crop and fertiliser program. Jar-test new combinations using the actual water and mixing order. Confirm compatibility before combining with strong acids or crop oils. Packs: 20 L, 110 L and 1,000 L.
Avoid contact with eyes and skin. If swallowed, do not induce vomiting. Contact the Poisons Information Centre on 13 11 26 or a doctor. Store closed in a cool, dry, well-ventilated area away from direct sunlight. Refer to the current SDS for full safety directions.
The application planner calculates product volume, cost and trace-element delivery. The nitrogen and soil tools explore user-entered scenarios. They do not predict a measured AdGreen response, prove a nitrification-inhibitor effect or assume a relationship between dose and NUE.
No finished-AdGreen field trial has been supplied to calibrate the scenarios. Component research and evidence from other formulations do not establish the yield response of this blend.
DOWNLOADS / PRODUCT INFORMATION

Consult the current approved label before use. Calculators provide planning estimates and use your inputs; example prices and response assumptions are not product performance claims.